The INtersections Progress Report illustrates how Team Dow continues to advance our ambition by focusing on purpose in action. Through our materials science expertise and strategic collaborations, we are striving to answer customer demand for sustainable products and create long-term value for our shareholders, our Company and society.
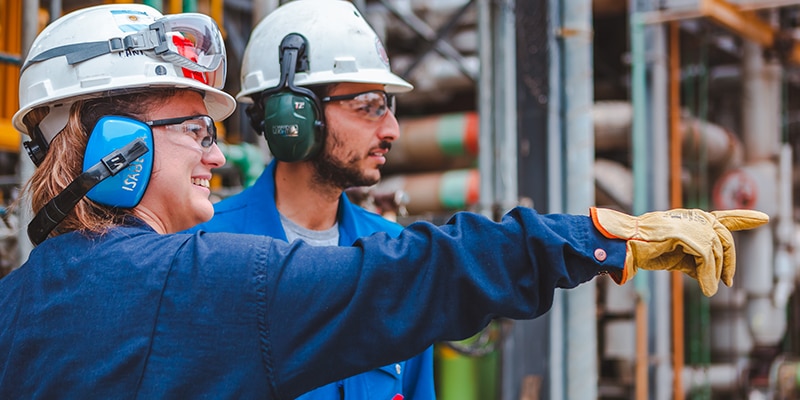
Learn how we make the world a better place as Team Dow. Through respect and integrity, we lead with our core values and innovative spirit to create more sustainable materials science solutions for everyone.

Discover how we’re accelerating positive change around the world. From climate protection and creating safer materials to our focus on global citizenship and inclusion, diversity and equity, Team Dow is making a difference in the communities where we live and work.
Find the latest press releases, news updates, awards and achievements from Dow and stay connected on the impact we’re making in the world.
Explore key collaborations and why we make partnership our passion. Through initiatives and sponsorships, we can work together to create a more positive impact for all.
Team Dow makes us one of the most innovative, customer-centric, inclusive and sustainable materials science companies in the world. Find opportunities to join Dow in a capacity that works best for you.
2024 INtersections Progress Report
Measuring our impact
![]()
>90%
of Dow's R&D portfolio is aligned to our sustainability areas of focus
![]()
77%
of Dow employees volunteered in their local communities in 2024
![]()
$33.7MM
invested in corporate, foundation, and in-kind contributions
![]()
92%
of board members are independent and average tenure of 7 years
![]()
61.4%
of Dow employees participate in at least one of our 10 global Employee Resource Groups
Advancing our ambition
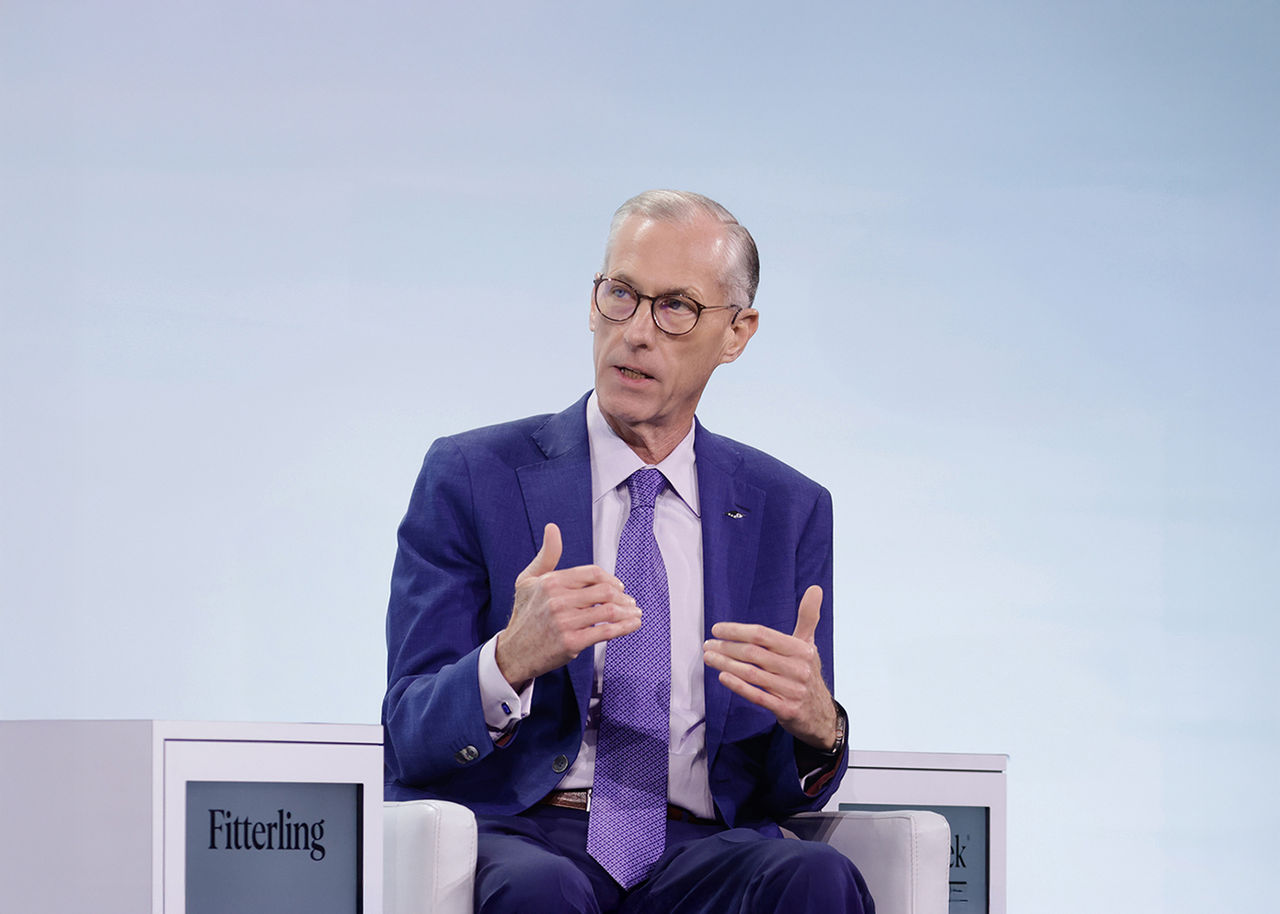
"In 2024, we made meaningful progress to answer customer demand for sustainable products, reduce greenhouse gas (GHG) emissions and drive circularity."
Jim Fitterling
Chair and Chief Executive Officer
Our commitment to the climate
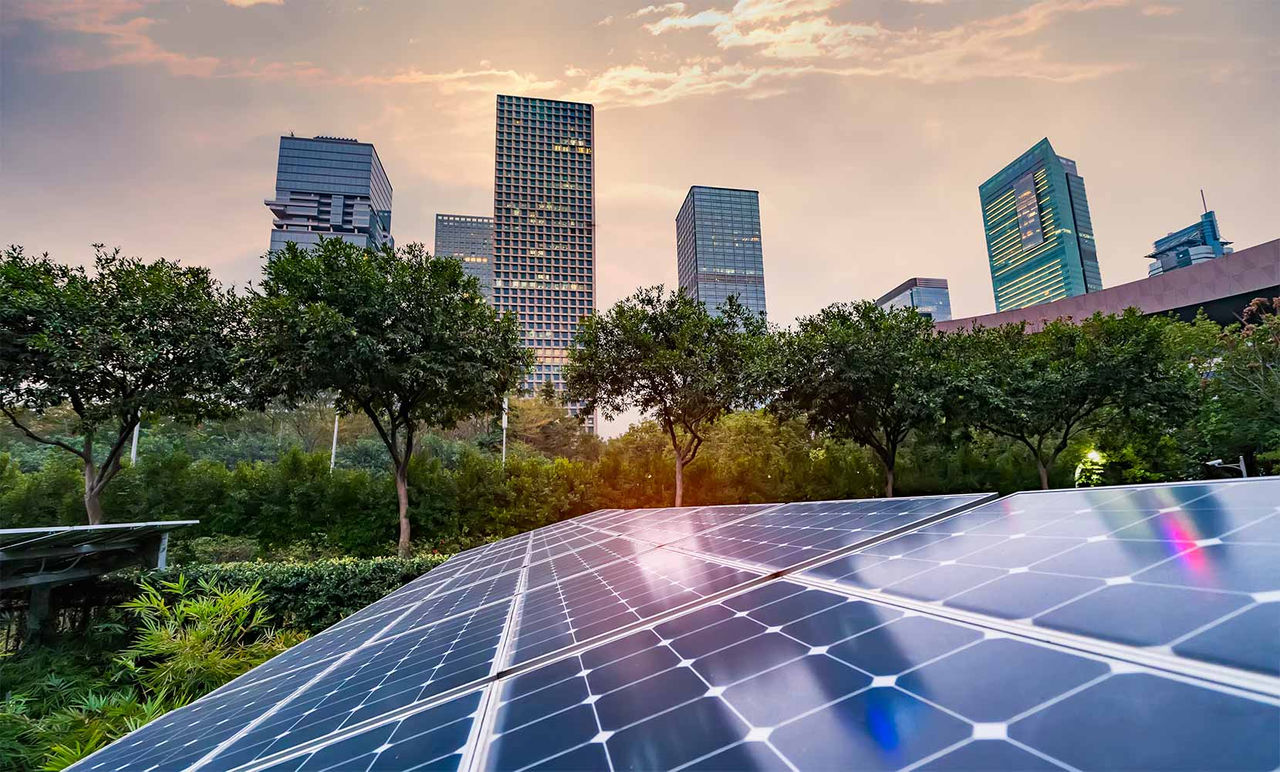
A holistic approach to climate protection
We are committed to both climate change mitigation and adaptation efforts, including reducing greenhouse gas emissions, advancing water stewardship, and supporting habitat conservation.
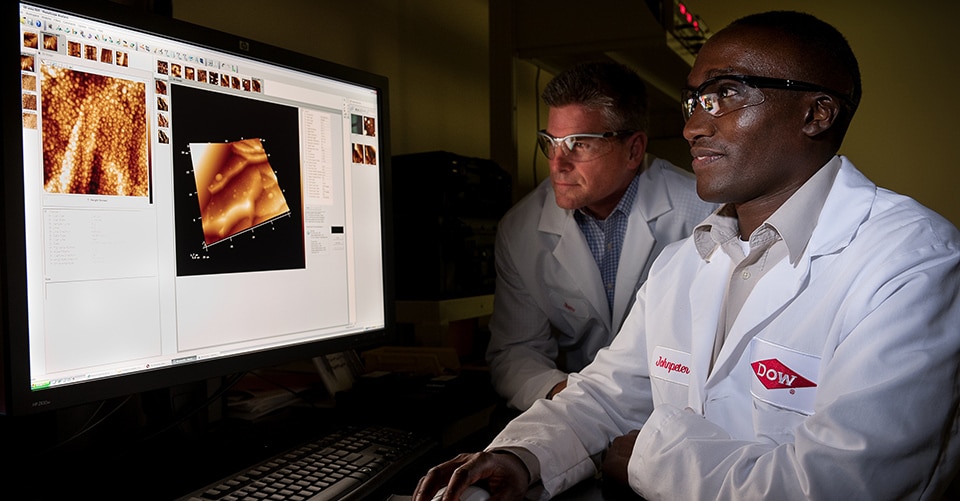
Collaborating for a circular economy
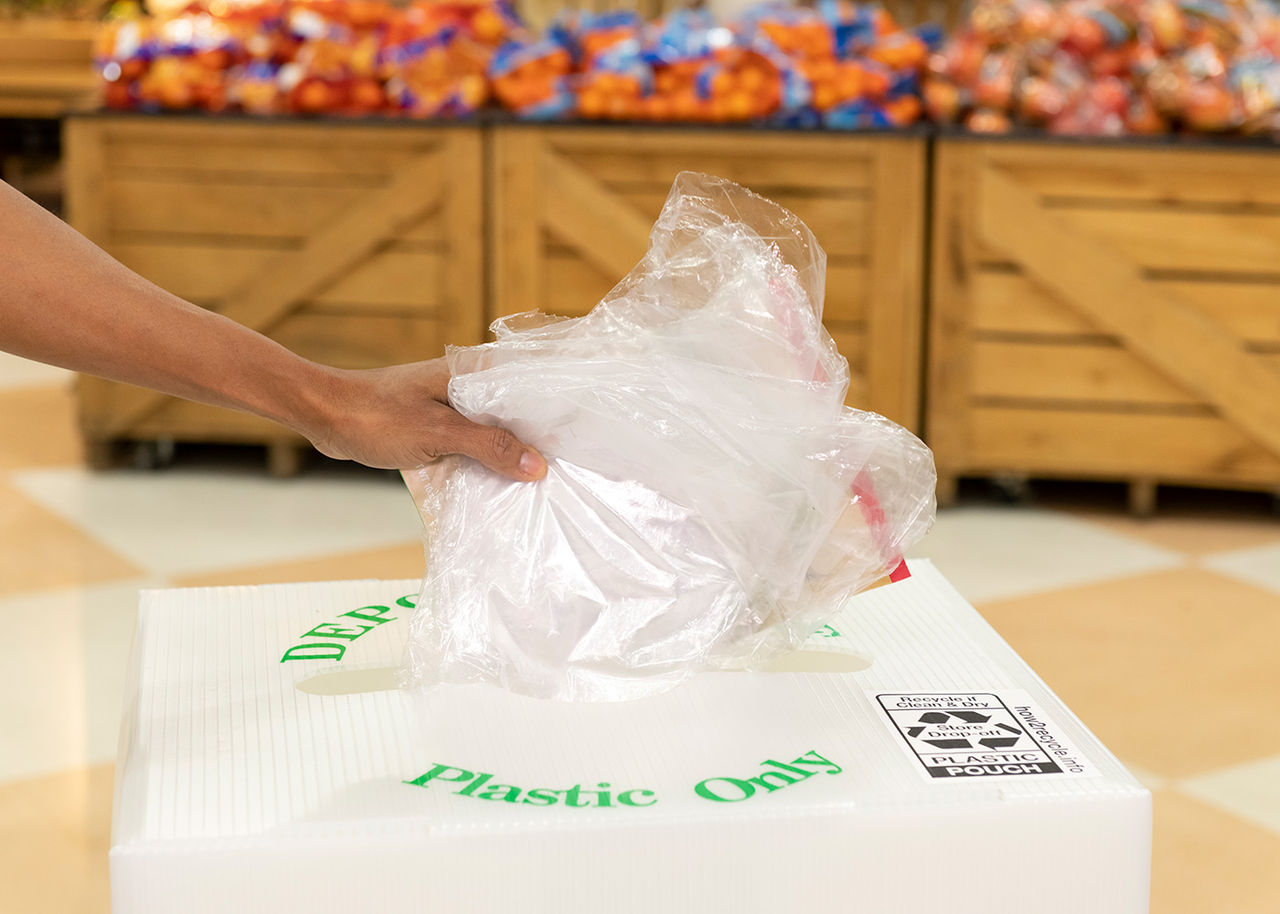
Team Dow is transforming the way materials are made, used and reused
Dow collaborates across the entire materials ecosystem from waste management infrastructure to diversifying feedstocks to designing innovative applications.
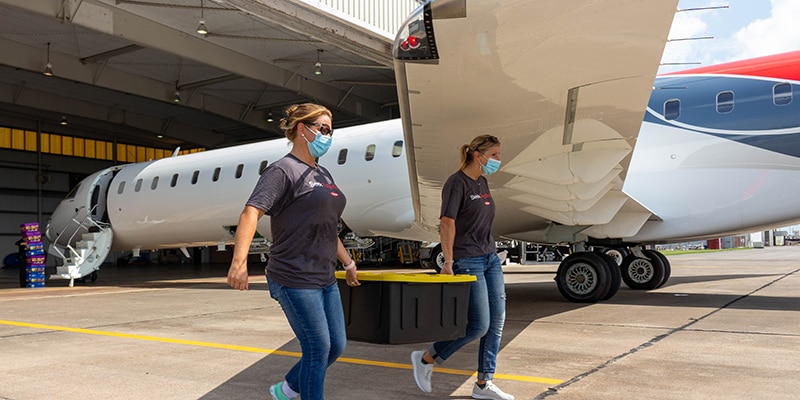
Helping our communities thrive
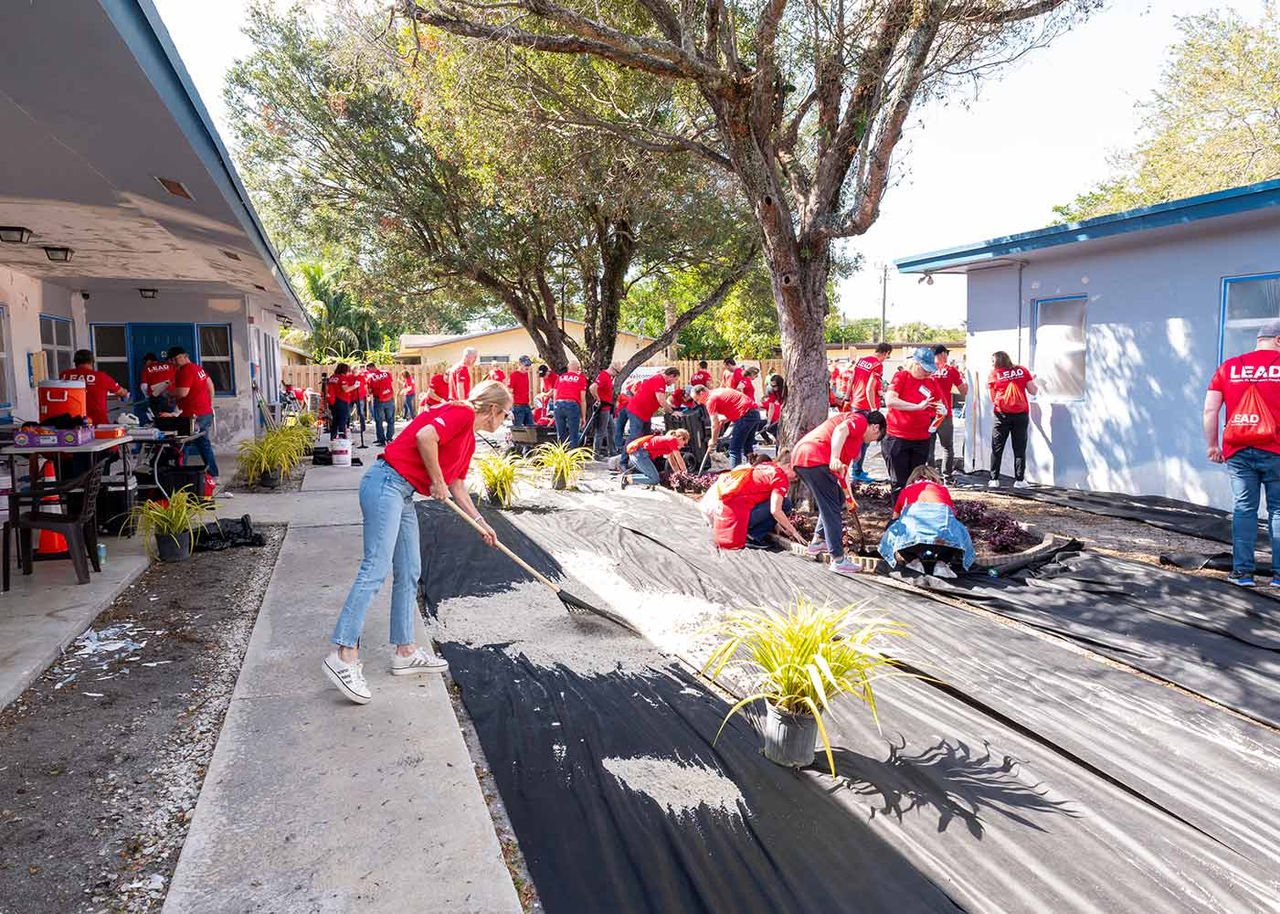
Giving back to our communities
We recognize our responsibility to the communities where we do business, and we continue to drive a culture that fosters caring about our people, our communities and our environment.
More ways where we're making a difference
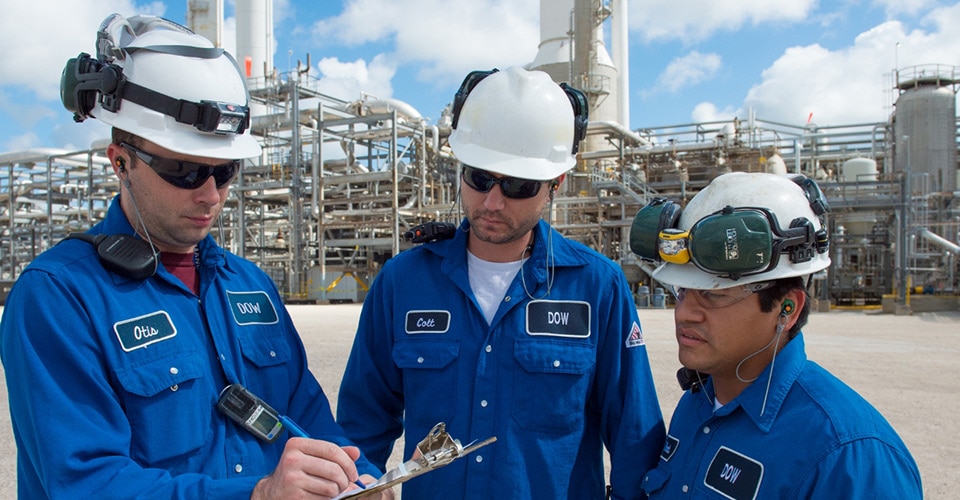
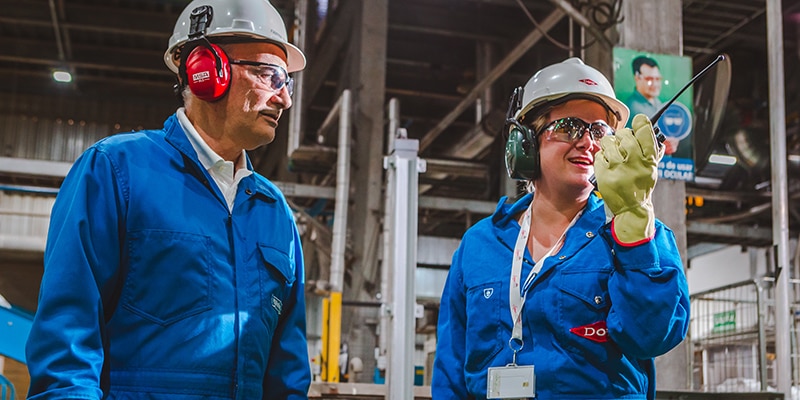
Health and Safety
Our number one priority is the health and safety of Team Dow and our communities.
Inclusion
We continue to advance a culture that enables our people, our Company, and our communities to grow and thrive.
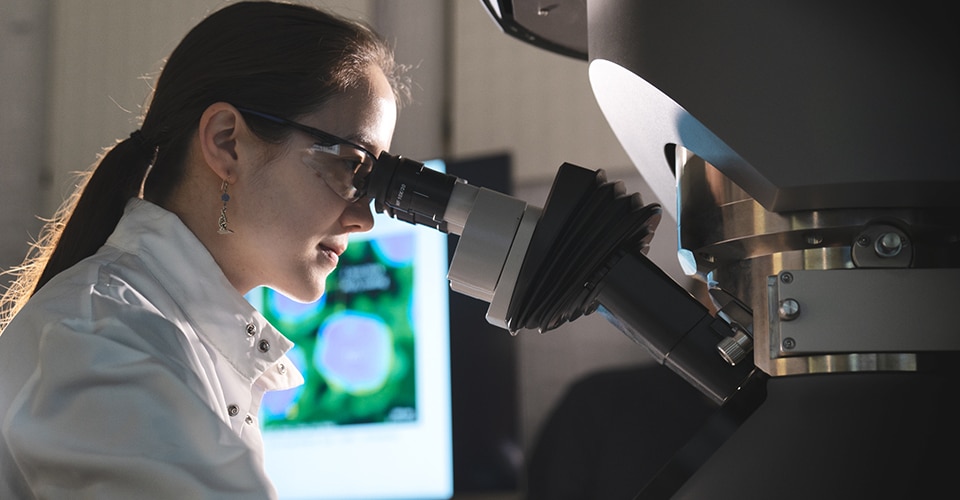
Safer Materials
We are committed to ensuring that the materials we offer – and the way we manage them along the way – are designed for the safety of people and the planet.
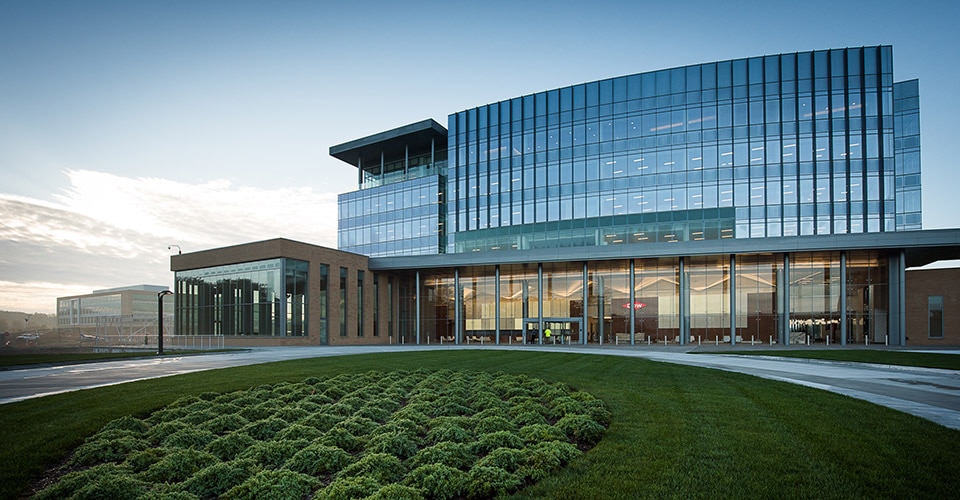
Corporate Governance
Our approach to corporate governance is centered on our core values and helps us create and maintain a culture that supports our long-term success, strengthens decision-making and builds trust in our Company.
INtersections Report and Disclosures
What's inside
Advancing Ambition
Protecting the Climate
Advancing a Circular Economy and Safer Materials
Cultivating a Thriving Team and Communities
Driving Accountability and Best-in-Class Performances
Stay in touch
Get alerts to stay up to date on the latest news, reports and blog articles.
Need help?
Reach out with any comments, questions or concerns.